Visualizing Business Workflows with the Five Hexagon Steps Process Chart
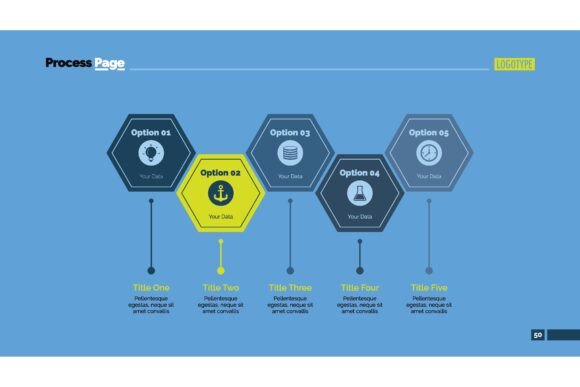
Every project starts with an idea, but clarity often gets lost between concept and execution. The Five Hexagon Steps Process Chart steps into that gap, transforming scattered thoughts into a sequence that teams can follow, adapt, and improve. It is not simply a graphic; it is a practical communication asset. By breaking down a workflow, decision, or strategic movement into five connected hexagonal stages, the chart gives abstract business data a structure that matches how people actually digest information—step by step, with room to see relationships at a glance.
This kind of process visualization sits comfortably inside a larger planning rhythm. It works before you launch a campaign, while you refine a training program, and long after a banking product goes live, providing a consistent reference point. Where a dense spreadsheet might bury insight and a bulleted list can feel fragmented, the hexagon layout forces thoughtful sequencing. Because the shape itself suggests interconnection—sides joining neatly—it automatically implies that each phase depends on the one before and feeds the one after. That subtle psychological cue helps stakeholders accept complexity without overwhelm.
Where Hexagon Process Charts Fit in a Modern Workflow
The Five Hexagon Steps Process Chart is at home wherever outcomes depend on predictable, repeatable actions. In marketing, a manager might map a customer journey: awareness, consideration, conversion, retention, advocacy—each encapsulated in a clean hexagon. In training, an instructional designer uses it to show a learning sequence: diagnose, design, deliver, assess, iterate. Banking teams adopt it for risk assessment workflows or client onboarding steps. In every case, the chart becomes a living document that can be pulled into presentations, internal wikis, and strategy decks without losing its clarity.
Because the format is so readily adaptable, it complements the tools professionals already use. You might build the chart directly in a slide deck app, then drop it into a project management platform as an orientation visual for new team members. Or you sketch it during a whiteboard session, refine it in a graphic design tool, and export it as part of an infographic series. The Five Hexagon Steps Process Chart doesn’t demand new software; it simply fits into the ecosystem of documents, dashboards, and training materials that keep business moving.
Practical Implementation Before a Project Begins
Before execution starts, the chart serves as a planning scaffold. Instead of opening a blank document and hoping for order, a team lead drafts five hexagons and labels each with a provisional step. This constraint—exactly five stages—forces prioritization. You must decide what truly belongs and what can be folded into a supporting activity. In a product launch, for example, the initial draft might read: research, prototype, test, refine, ship. Immediately, gaps become visible. Does research include competitor analysis, or does that sit elsewhere? The chart triggers those conversations early, when correcting course costs nothing.
During this preparatory phase, the hexagon structure also helps align cross-functional groups. A marketing lead can share a draft with sales, operations, and customer support, and because the visual language is minimal, there’s little room for misinterpretation. Adjustments are handled by re-labeling or slightly reordering steps, not by rewriting dense paragraphs. This rapid iteration preserves momentum and keeps everyone oriented toward a shared outcome.
Using the Chart During Active Work and Execution
Once a project is underway, the Five Hexagon Steps Process Chart transitions from blueprint to dashboard. Teams often display it prominently in collaboration spaces or pin it in messaging channels. When a task stalls, a quick glance reveals where friction sits—maybe the third hexagon, the testing phase, keeps getting pushed. That visibility encourages proactive problem-solving rather than reactive firefighting. Because the chart is non-linear in appearance but linear in logic, it communicates sequential progress while still showing that all stages coexist in the same system.
For individual professionals, the chart functions as a personal workflow anchor. A freelancer managing multiple clients might keep a version for each engagement, tracking where every project stands. A small business owner can use it to standardize daily operations: inventory check, order fulfillment, quality review, shipping, follow-up. The simplicity of five stops prevents cognitive overload, yet the hexagon shape adds enough visual weight to demand attention. It’s far harder to ignore a colored hexagon on a screen than a line of text in a to-do list.
Post-Project Review and Long-Term Process Refinement
After a project closes, the chart becomes an audit tool. Teams can revisit the original five steps and ask honest questions: Did we need all of them? Was the sequence correct? Should one hexagon be split into two, or two merged into one? This retrospective application turns the Five Hexagon Steps Process Chart into a continuous improvement mechanism. Because the format is reusable, you can archive the old version, create a revised template, and immediately apply it to the next initiative. Over time, an organization builds a library of proven process patterns, each documented with the same clean hexagon visual language.
In training contexts, this archival value is particularly strong. New hires can study past project charts to understand how the company thinks about execution. Instead of sifting through dozens of meeting notes, they absorb the key milestones quickly. The hexagon layout acts as a memory aid; people recall shaped sequences more readily than abstract lists, which helps institutional knowledge survive staff turnover.
Compatibility with Other Planning Tools and Platforms
One of the most practical strengths of the Five Hexagon Steps Process Chart is how gracefully it integrates with other resources. You can embed it inside a larger infographic, where each hexagon expands into a detailed breakdown. Presenters often use it as an agenda slide, then dedicate subsequent slides to each step. In digital workspaces, it becomes a clickable hub—each hexagon linked to a relevant document, spreadsheet, or task board. This connectivity amplifies its usefulness far beyond a static diagram.
Collaboration with people is just as important. When a chart is shared externally, with clients or partners, the hexagon design signals professionalism without being flashy. It respects the viewer’s time by communicating structure instantly. Clients don’t need to learn a new notation; they see five connected stages and instinctively understand the narrative flow. That ease of comprehension accelerates buy-in, reduces meeting time, and keeps conversations focused on content rather than format.
Maintaining Consistency and Quality Control Through Templates
Organizations that adopt the Five Hexagon Steps Process Chart often create a master template with predefined colors, fonts, and sizing. This step alone eliminates the visual drift that happens when different departments build their own diagrams from scratch. Consistency matters because it builds recognition; a sales team looking at a marketing chart immediately knows where to find the current stage, and vice versa. It also conveys careful thinking. Sloppy visuals subtly erode trust, while clean, standardized charts reinforce that processes are under control.
Quality control extends to the content inside each hexagon. A best practice is to pair a short label with a single sentence of context, placed either inside or directly below the shape. This prevents the common mistake of overstuffing a diagram with text, which defeats its purpose. If a step needs extensive explanation, link out to a detailed procedure document. Keep the chart crisp enough that it can stand alone but connected enough that it never leaves anyone stranded. This balance takes practice, but once achieved, the template saves hours every month.
Practical Tips for Crafting a Useful Five Hexagon Chart
Start with a real process, not a theoretical one. Gather a small team and map what actually happens from trigger to outcome. Resist the urge to design the chart first; let the steps emerge from honest conversation. Then fit them into the five-hexagon framework, challenging each step’s necessity. If you find yourself with four or six natural stages, adapt—split a complex stage into two, or combine minor ones. The number five is a guide, not a strict rule, but sticking close to it keeps the visualization digestible.
Use color with intention. Subdued tones work well for internal process documents, while bolder palettes suit client-facing presentations. Color-code the hexagons to reflect status when the chart is used as a real-time tracker: gray for not started, blue for in progress, green for completed. This small addition turns the static asset into a dynamic status board. Just make sure the colors remain distinct for those with color vision deficiencies; adding a subtle icon or number inside each hexagon provides an inclusive fallback.
Finally, treat the chart as a living object. Processes evolve, and the chart should evolve with them. Schedule a quick review every quarter to confirm the five steps still represent reality. If they don’t, update the master template and communicate the change. This discipline keeps the organization nimble and prevents the chart from becoming decorative wallpaper.
Real-World Use Cases Across Functions
- Marketing Campaign Rollout: Plan, Create, Review, Launch, Measure. Each hexagon anchors a set of tasks, and the visual serves as the campaign hub that creative, media, and analytics teams reference daily.
- Training Program Development: Assess Needs, Design Curriculum, Pilot, Deliver, Evaluate. The chart doubles as the syllabus overview for learners, setting clear expectations from day one.
- Banking Product Introduction: Market Research, Compliance Check, Build Infrastructure, Soft Launch, Full Rollout. Regulators and internal auditors appreciate the transparent step-by-step record.
- Freelance Project Management: Discovery, Proposal, Execution, Revision, Handoff. A single-screen summary keeps the freelancer and client aligned without endless email threads.
- Small Business Operations: Order Received, Prepare, Quality Check, Deliver, Invoice. Employees follow the chart posted in the workspace, reducing training time and error rates.
Efficiency Gains and Organizational Benefits
Efficiency doesn’t come from the chart alone; it comes from the alignment the chart creates. When everyone uses a shared process visualization, handoffs happen faster. A marketing specialist finishing the creation step knows the next owner is the review team, and that the hexagon boundary signals readiness. This structural clarity cuts down on status meetings and “where are we?” emails. In a fast-paced environment, those saved minutes compound into meaningful capacity gains.
Organizationally, the Five Hexagon Steps Process Chart promotes a process-aware culture. Team members begin to think in terms of stages and dependencies, which improves planning across the board. They start proposing improvements not as vague complaints but as specific suggestions: “I think the third hexagon needs a parallel approval path.” That kind of granular feedback strengthens operations far more than general admonishments to “be more efficient.”
Long-Term Use and Sustainable Value
The lasting value of this chart style rests in its simplicity and adaptability. It doesn’t rely on expensive software or specialized skills; anyone comfortable with basic diagramming tools can create and maintain it. As the organization grows, the chart scales gracefully. What begins as a single department’s workflow can become an enterprise-wide standard, with variations for different contexts while retaining the familiar hexagon motif. This longevity makes it a safe investment of attention—unlike graphic trends that date quickly, the geometric clarity of five interconnected hexagons remains timeless.
When implemented thoughtfully, the Five Hexagon Steps Process Chart becomes more than a visual. It turns into a shared language for how work gets done. It bridges gaps between strategy and daily tasks, between teams that rarely speak, and between the plan and the outcome. By embedding this tool into presentations, templates, and everyday documentation, you’re not just illustrating a process—you’re embedding a clear, repeatable way of thinking that strengthens every project it touches.